Tools / Usability numbers
Usability numbers Free
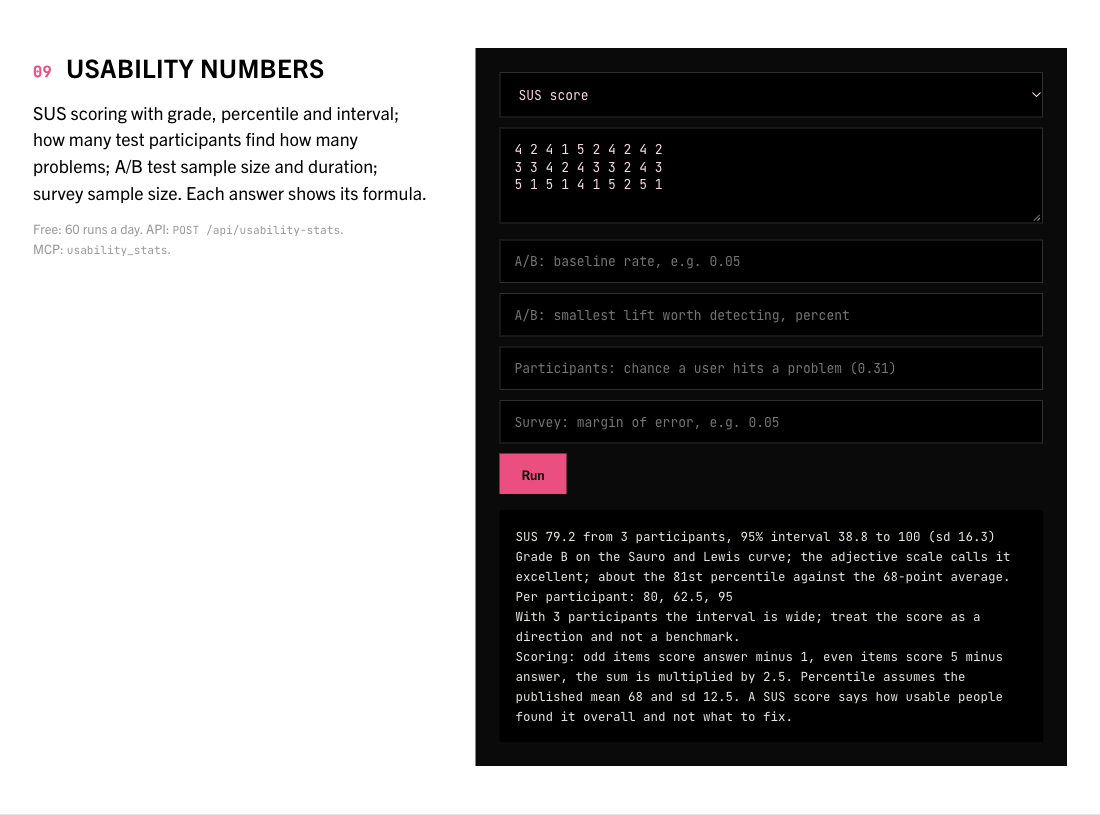
SUS scoring with grade, percentile and interval; how many test participants find how many problems; A/B test sample size and duration; survey sample size. Each answer shows its formula.
MCP tool name: usability_stats. REST: POST /api/usability-stats. Free: 60 runs a day per IP. Pro: no cap.
Ask for it in plain words
Usability arithmetic with formulas shown. mode sus: score System Usability Scale responses (rows of ten 1-5 answers) with grade, percentile and 95% interval. mode discovery: participants needed to find a share of problems (Nielsen and Landauer). mode ab: sample size per variant for a conversion test (baseline, lift in percent, optional dailyVisitors). mode survey: responses needed for a margin of error.
Inputs
| Name | Type | Meaning |
|---|---|---|
mode | string (sus, discovery, ab, survey) | Which calculator |
responses | array | sus: array of 10-number arrays |
p | number | discovery: chance a participant hits a problem, default 0.31 |
target | number | discovery: share of problems to find, default 0.85 |
baseline | number | ab: current conversion rate, e.g. 0.05 |
lift | number | ab: smallest relative lift to detect, percent |
alpha | number | ab: significance level, 0.1, 0.05 or 0.01 |
power | number | ab: 0.8, 0.9 or 0.95 |
dailyVisitors | integer | ab: traffic per day, to estimate how long to run |
margin | number | survey: margin of error, e.g. 0.05 |
confidence | number | survey: 0.9, 0.95 or 0.99 |
population | integer | survey: total population, for the finite-population correction |
* required
Example
curl -X POST https://designers.allthepossibles.com/api/usability-stats \
  -H "content-type: application/json" \
  -d '{"mode":"sus","responses":"4 2 4 1 5 2 4 2 4 2\n3 3 4 2 4 3 3 2 4 3\n5 1 5 1 4 1 5 2 5 1"}'
Example output
The report field, for the input above (structured fields come back alongside it):
SUS 79.2 from 3 participants, 95% interval 38.8 to 100 (sd 16.3)
Grade B on the Sauro and Lewis curve; the adjective scale calls it excellent; about the 81st percentile against the 68-point average.
Per participant: 80, 62.5, 95
With 3 participants the interval is wide; treat the score as a direction and not a benchmark.
Scoring: odd items score answer minus 1, even items score 5 minus answer, the sum is multiplied by 2.5. Percentile assumes the published mean 68 and sd 12.5. A SUS score says how usable people found it overall and not what to fix.
What it looks like
Limits of this tool
Each answer prints its formula and the assumption that most often breaks it.